Admissions Flash Survey Reveals Varying Enrollment Circumstances

The results are in from a February 2026 admissions flash survey triggered by member school inquiries and conducted in partnership by the Enrollment Management Association (now E3n) and Mission & Data. Submissions from 495 independent school enrollment leaders in the United States and Canada show broad variability across schools and underlying concerns in year-over-year applications received.
Headlining the concerns schools have are family perceptions of affordability and value, increased financial aid requests from prospective students, competition, retention, and international student enrollment.
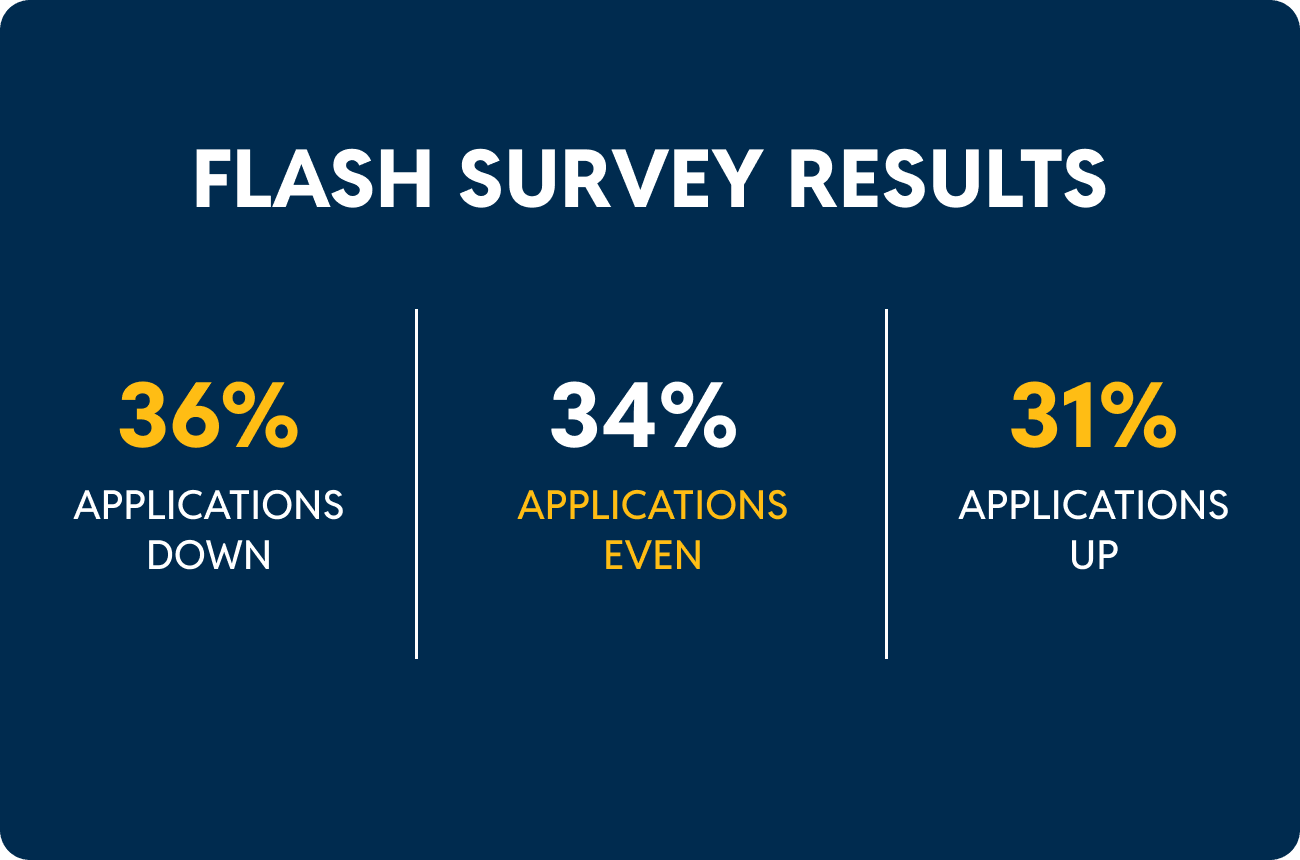
"Compared to this time last year," said Christina Dotchin, chief program officer, E3n, "our schools are practically split into thirds between those experiencing increased interest, those with roughly the same results, and those with declining applications."
.png)
Overall, 22% of schools reported increased applications of 5–15%, and another 9% have growth over 15%. In the middle of the pack are 34% of schools with a comparable amount of applications submitted to the previous year. Significantly, 27% have applications declining by 5–15%, with another 9% seeing applications dip by more than 15%.
"That's a positive or acceptable outcome for two-thirds of our schools," Dotchin said, "but for the remaining third, the main takeaway is that you aren't alone and we're here to help.
"Each school's location, day or boarding status, and other factors such as grade levels and gender all have agency in the results. For example, schools in Atlanta, Boston, and Seattle—all traditionally strong regions for independent schools—are seeing the greatest decreases in application volume, while Houston, New York City, and the Dallas-Fort Worth area are experiencing the most growth.”
When asked about the top concerns for the remainder of the enrollment season, several items emerged. Amongst all respondents, three of the top four concerns are financially driven, with perceptions of affordability (55% selected), increased financial aid requests (44%), and perceived value of an independent education (43%) topping the list. Retention of current students follows closely behind at 41%.
“These concerns reflect the holistic nature of strategic enrollment management and the need to see it as a schoolwide priority,” shared Ari Betof, co-founder and partner of Mission & Data. “In many markets fundamental questions of the value of an independent school education are layered upon competition, concerns about affordability, soft applicant pools, and rising attrition. Independent schools cannot address these concerns in isolation or hope that the enrollment office can address these challenges alone. Retention and perceived value must be whole school efforts.”
"The financial concerns are validated by 41% of schools receiving increased financial aid applications from prospective students this year," Dotchin said. "It's also noteworthy that, on average, none of the metro areas captured in the survey are reporting decreases in financial aid requests."
For schools with a boarding component, 51% of enrollment leaders identified international student enrollment as a top concern for the remainder of the enrollment season. Standard Application Online (SAO) data confirms a 15% drop in international applicants. Only 47% of schools with boarding were completely or fairly confident that the school would reach its enrollment goals. Even fewer (39%) were completely or fairly confident the school would reach its net tuition revenue goal.
"We want to sincerely thank everyone who completed the flash survey during the hectic candidate review season,” Dotchin said. “Our member schools can now access the data dashboard in the EMA Community for a closer look at the metrics that matter most to you."
Survey Demographics
Demographics of the schools that participated in the survey are broken down as follows:
- 495 schools in the United States (97%) and Canada (3%)
- 86% coeducational; 9% all-girls; 5% all-boys
- 73% day; 11% day-boarding; 16% boarding-day/boarding only
- 55% suburban; 30% urban; 15% rural