Where Have All The Inquiries Gone?


From Memberanda (The Yield), Spring 2012
Currently, forces are both changing the shape of the funnel and impacting conversion metrics.
First introduced in the 1970s, the admission funnel shows the progression of prospects ➔ inquiries ➔ applicants ➔ acceptances ➔ enrolled students and has been the cornerstone of admission operations for decades. The funnel, developed to offer a systemic view on student recruitment, provides critical data on how opportunities translate from one stage to the next (or not) and enables schools to measure their progress from one year to the next vis-à-vis the competition. Crucial marketing, budgeting, personnel, and strategy decisions are made using data gleaned from the inquiry-to-enrollment process. Currently, forces are both changing the shape of the funnel and impacting conversion metrics. Maintaining a comfort level with a decline in acceptance rates and a higher frequency of incomplete applications appears to be admission’s "new normal."
In the last decade, independent school admission offices have seen a precipitous decline in the number of inquiries, greatly and disproportionately narrowing the top of the admission funnel. In 2001, independent day schools received eight inquiries per enrolled student. In 2009, those schools received just five inquiries per enrolled student (NAIS Tables, Admission Ratios and Percentages). An inquiry in today’s admission world – where families can anonymously research schools online – is fast becoming a precious commodity. This phenomenon is certainly not unique to independent schools; higher education professionals write about "secret shoppers" and "stealth applicants." Noel-Levitz’ 2010 Admissions Funnel report states that 32% of first-year students and 51% of transfer students applying to private colleges and universities do not identify themselves until they apply for admission.
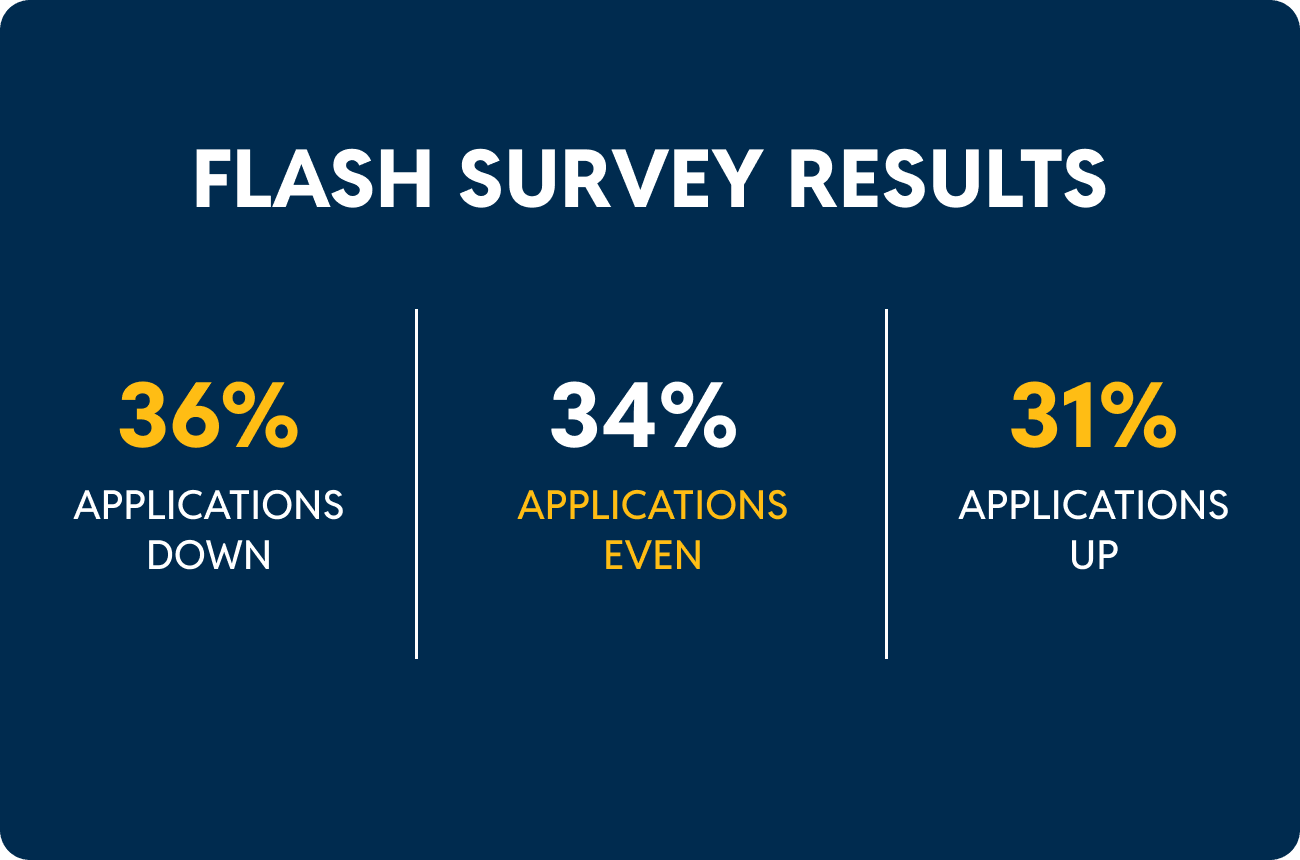
While inquiries were down across the board for all categories of schools from 2001-2009, this is not the case for applications (NAIS). Boarding, boarding-day, and day-boarding schools all saw an increase in applications during this time. Surely the ease of applying, especially online, is leading to an increase in the number of applications, as is the fact that families need to maximize their chances that a school can meet their growing financial aid needs. Episcopal High School (VA) told EMA that according to the financial aid form for one EHS applicant this year, the student had applied – or at least sent an RFC to – 33 schools. SSAT data also supports this phenomenon; while EMA is experiencing slight increases in overall test takers (with the exception of testers in China, where a large increase has occurred), EMA has seen a 15% increase in the number of SSAT score reports sent to schools.
The changing funnel depicts decreasing inquiries, increasing applications, and fairly consistent numbers of enrolled students. How can admission offices operate if they can’t rely on historical funnel metrics for guidance? Noel-Levitz, going so far as to say that the inquiry-to-applicant conversion rate is becoming a meaningless metric, advises colleges that "admission teams must adapt to the new ways that prospective and future students enter (or don’t enter) the admissions funnel, as well as evolving yield and admit rates." Among other things, they advise colleges to "stick with it" because "without funnel data everything becomes just a guessing game." Using multiple funnels is another recommendation, "so you can analyze each of the pieces separately and further understand what is working well and what isn’t." One metric that colleges track is the application to admit ratio for students depending on the kind of application submitted – paper, online, Common, etc.
It may also be necessary to use different, and multiple, means to achieve response and yield rates as the top of the funnel narrows. Noel-Levitz’s Jim Mager asserts instead of measuring response rates to individual recruitment efforts, it may be necessary to track just the percentage of prospects who apply, and the percentage that then enroll. Determining which of the enrollees were identified in the initial prospect stage of the funnel can help determine whether the right prospect names are being obtained. True inquiries should be seen (and tracked) only as those that identify themselves prior to application. Including only these students in yield predictions will provide a better sense of true yield. It also may be helpful to separate applicants by subgroups (applied online vs. paper; geographic region; schools that share the applicant, etc.) says Mager, in order to obtain a more accurate sense of recruitment activities’ successes.
Moving from Generating Demand to Building Relationships
Since a growing percentage of students have already conducted "stealth" research on schools via websites, word-of-mouth, social media, and other means prior to expressing interest in a school, they are less likely to be influenced by broadcast communication methods and require a more individual and personalized form of communication, according to a report by SunGard Higher Education. In addition, those students who do enter the funnel in the traditional manner are most likely to desire immediate relationship-style communication, since the chances are quite good that they’ve already done their research. This means that the majority of prospects are not receiving or processing the communications traditionally set at prescribed points in the enrollment process.
Does this mean that the traditional methods (emails, letters, viewbooks) must be jettisoned in favor of websites and Facebook pages? No. But it does mean that the traditional forms of recruitment communication should be reconsidered and modified with an eye towards creating a more personal experience, says SunGard. It means that websites should contain much of the information that would ordinarily find its way into an introductory direct mail piece and should create a plethora of options for communicating – from a live IM session with students, to quick online forms that indicate specific interests, to apps that give the student a virtual campus tour and ask for feedback. Competencies in these areas will be critical to competing in a funnel-changing world.
School websites seem to be geared more toward the enrolled student community than on capturing prospective students. G5 Search Marketing’s research indicates that "a poor online presence could be costing [companies] a 10 percent loss in potential new customers, a 25 percent loss in potential new leads, and $30 to $150 more per lead." In addition, school sites without adequate "calls to action" and simple landing pages (for basic student information capture) contribute to the decrease in inquiries and loss of prospects, as students "opt out" on feel without giving schools a chance to put a more personal foot forward.
Clearly, the admission funnel has changed its shape, and the advent of new technologies means that it will likely continue to do so. In order to adjust, admission offices must identify and quantify prospective student data in new and specific ways. Yield determination must account for students that enter the funnel both at the top and at the bottom. Communication strategies must involve traditional and untraditional methods, while embracing technology to establish relationship-style communications that speak to individual information needs. And no matter when applicants become known, they must be included in the conversations around strategy, yield, and the larger enrollment management picture.
Sources:
Noel-Levitz. (2010). Fall 2010 admissions funnel benchmarks for four-year public and private institutions. Coraville, Iowa: Author. Retrieved from: www.noellevitz.com/ChangingFunnel
"Getting Found: What Your Company Needs to Know about Your Company’s Online Presence," G5 Search Marketing, 2011.
"How Do You Deal with a Changing Admissions Funnel?" noellevitz.com, Dec. 10, 2010.
"Important Steps to Avoid Enrollment Surprises in Mid-April," Jim Mager, noellevitz.com, Feb. 22, 2012.
NAIS StatsOnline: NAIS Tables, Admission Ratios and Percentages
"Strategies for Connecting with the 21st Century Student," SunGard Higher Education, 2007.